The internal XtraReports designer supports automatic calculation of summary functions (totals, maximum, minimum, averages, etc.) only for XRLabel controls (or its descendants) which are bound to data.
A full set of the summary functions that can be automatically calculated with XtraReports is listed in the SummaryFunc enumeration. Note also, that a summary value can be correctly calculated only if a label is bound to either numeric or date/time data.
All the summary options available are listed by the XRSummary object which is returned via the label's XRLabel.Summary property.
To calculate an automatic summary for a label you should be aware of the following:
•A summary is calculated only if data is bound to the XRControl.Text property of a label.
•An automatic summary can be calculated either for all the values in a particular group or the entire report.
•A label should be located in the report band which corresponds to the values it will be calculated for.
•This means that if a summary is calculated for a group, then the label should be located either in that group's header or footer band.
•At design time you can also use the Summary Editor to set all the summary options in one place.
•Since the summary value is calculated after the XRControl.BeforePrint event has been raised, the summary value can't be accessed from within the BeforePrint event. Use the XRSummary.GetResult method to get the summary's value, or handle the XRLabel.SummaryCalculated event to get the summary value calculated and perform any additional actions required after the automatic summary value has been calculated.
•It is suggested that you open up the existing sample report templates to see existing summaries such as those in the Sample Detailed Service Workorder with Grand Total report template. Also check out the answers to questions about report template design in the AyaNova Support Forum and additional sample report templates there that you can download, use as is or customize further
In this tutorial we will look at an existing sample report template to view use of an automatic summary, and go through the steps to create an automatic summary.
It is recommended that you review the Report Templates Help sections before proceeding for an overview of the Report Designer.
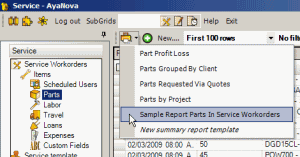
1.Select the Parts sub-grid within the Service navigation pane
2.Drop down the Print menu option, hold down the SHIFT key on your keyboard, and select the report template Sample Report Parts In Service Workorders
3.Select Preview at the bottom of the design panel to see what results print before modification.
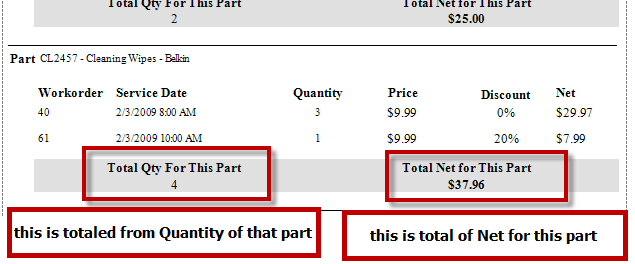
4.This sample report
•Groups the part
•Lists the Quantity of that part for that workorder
•Totals all Quantities of that part for all workorders
•Lists the Net of that part for that workorder
•And totals all of the Net for that part for all workorders
5.In the Design Panel, select the Sum([Quantity]) datafield control in the GroupFooter1
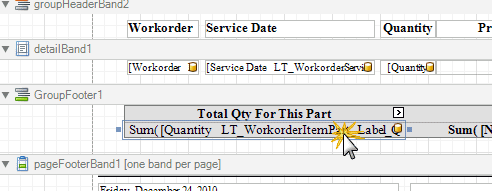
6.With that field xrTableCell3 still selected, click on the Properties tab, and select the browse icon to open the Summary Editor window
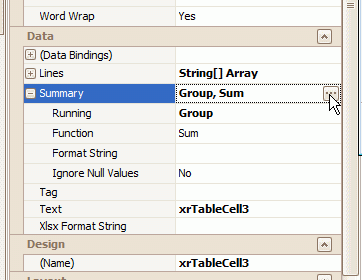
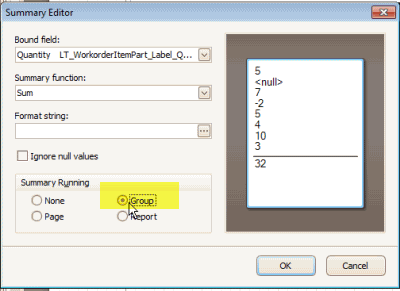
7.You will note that the bound field is to the Quantity field and that the Summary function selected is Sum and that the Summary Running is Group
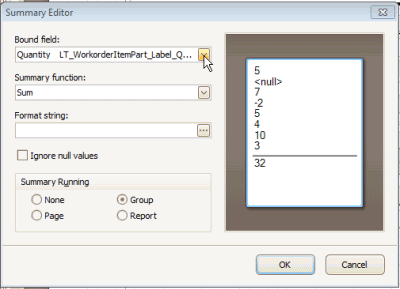
a.What this means is the Quantity field is summed up for what is set as the group - in this case, for each part as that is what this report is grouped by.
b.Note that there are other Summary functions available, like Avg (average), Max (maximum), Min (minimum) and so on.
c.Cancel out of this Summary Editor
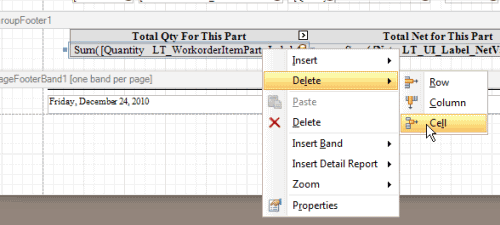
8.Now we are going to remove that present datafield, and replace it again so you can go through the steps on how to set a Summary for a bound data field
9. Right-click on the Sum([Quantity]) datafield control (you should see that in Properties it is referring to the xrTableCell3 field), select Delete, select Cell
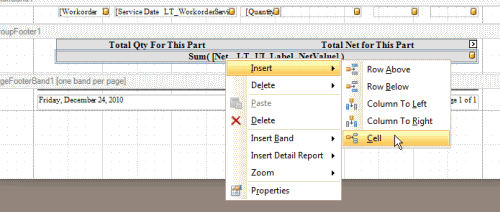
10. Now there is only one cell in this table row - so right-click on the Sum([Net]) datafield control, select Insert, select Cell
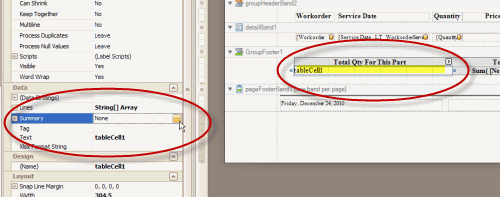
11.Select the new TableCell that was created to the left of the Sum([Net]) data control field to highlight it, and select the Properties tab so that you can now edit Properties for it
12. Select the Summary property field browse button to open the Summary Editor
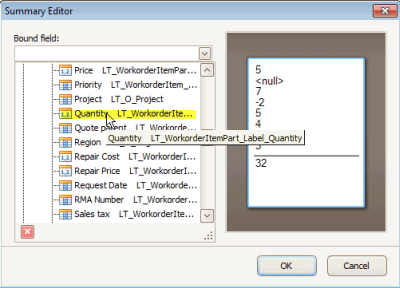
13. In the Summary Editor, drop down the Bound Field, expand the WorkorderServicePartList, and select Quantity
14. Sum is already selected for the Summary function. Select Group for the Summary Running. Select OK to close
15. Select the link Preview to preview what the report looks like so far
16.You will note that although we now have the group sum - the text alignment is to the left instead of center, and the background color still needs to be edited, and the font needs to be Bold because we deleted the original cell with its formatting. You can always click on another field and see what its appearance properties are set to for reference.

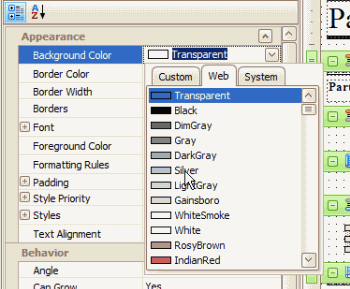
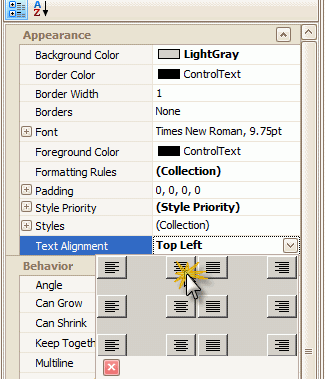
17. Back in the Design Panel, select the Properties tab for this field, and edit its text alignment and background color and font. A suggestion is to also compare against the properties of the other sum field too.
18. Select the Preview link to view that the changes are now similar to that of the other field and as before
19. Save and close the report.
You have now customized a report template to include a automatic summary, and can use this knowledge when customizing and/or creating other report templates