Scripts in a report template can be used to:
•obtain a grand total of amounts
•manipulate amounts
•display custom fields in a certain way
•set format
•provide custom summaries
•prevent bands from displaying if no data
•merge multiple datafields to display in the same field
•display checkbox instead of text True or False
•have custom field display as currency
•and much more uses
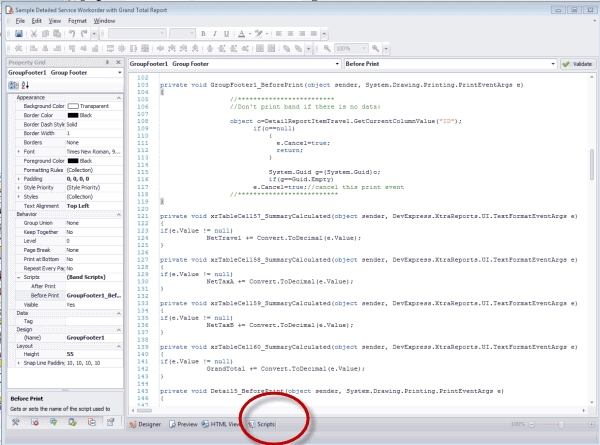
•Using scripts requires that you have a working knowledge of C#
You can familiarize yourself with report scripts by: examining the existing sample report templates, checking out the AyaNova Support Forum https://forum.ayanova.com , and in the tutorials in this Help file.
Another suggestion is to do searches online (i.e. Google) entering in text such as C# and whatever it is that you are trying to do - for example to get an overview of what might be needed, enter the text C# string empty in a Google search to determine if a string is empty and read over the results to get ideas and examples
3. To see Scripts Errors after validation
4. To jump to a specific existing script
5. To create new script for a specific band or label
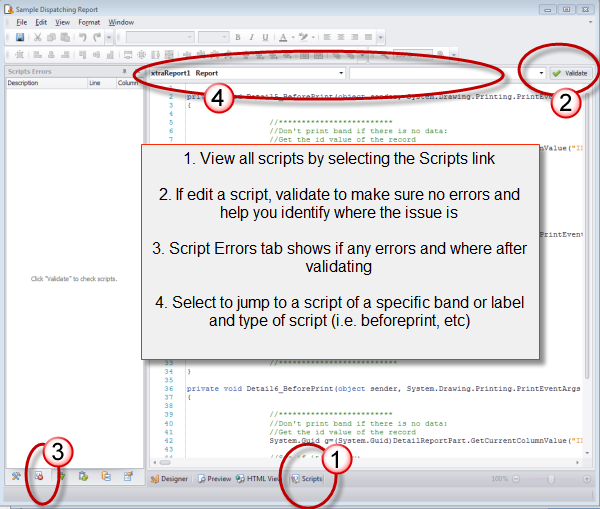
1. To see existing scripts in a report template, click on the Scripts panel selection
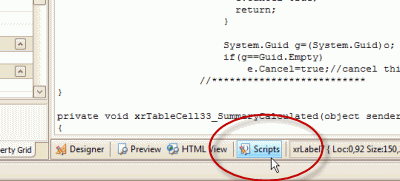
2. If you make any edits to any scripts, use the Validate to make sure no errors. It will not fix the errors, but it will let you know if there are errors.
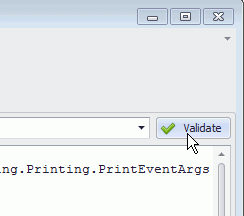
3. Errors will display in the Scripts Errors tab so you can see what line and column has an issue, and resolve it. Of course, the error description because of the way scripts are, may not be specific to resolve the issue - as in that in the screenshot below, the issue is actually because the DetailReportTask has a space in it.

4. If you want to edit a specific script for a specific field or band without scrolling through them all, just drop down and select the band or field the script is for and what type of script it is
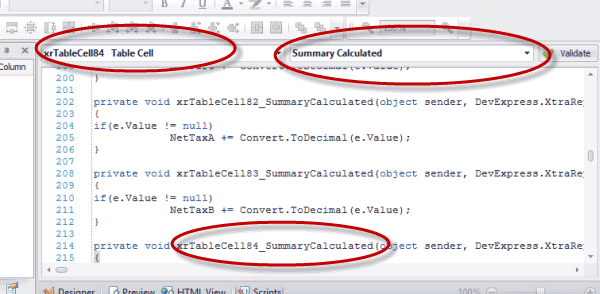
•Note of course, that if you select a band or script, and a script type that does not presently have a script, the report designer will input for you at the bottom of the list of existing scripts as assuming you meant to create a new script
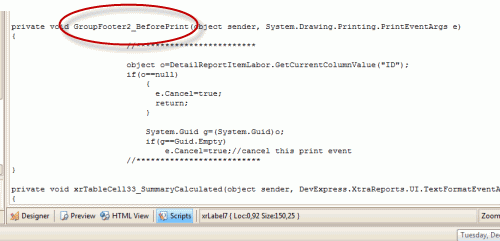
•You can identify which script is for which band or label etc as each is identified in its code. For example, the screenshot below, we know this is the Before_Print script for the GroupFooter2 band.
5. Create a new script for a specific band or label either from the Properties for the band/label, or selecting within the Scripts panel:
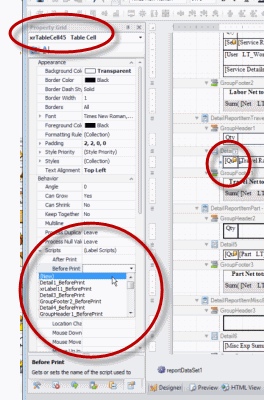
a. Create new script from the Properties for the band/label:
i. click on the band or label you want to create the script specifically for
ii. view the Properties tab
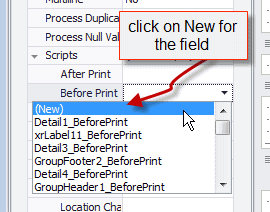
iii. expand the Scripts property, and select New for the script type you want
iv. the script command structure will be added into the Scripts for you to now edit as needed
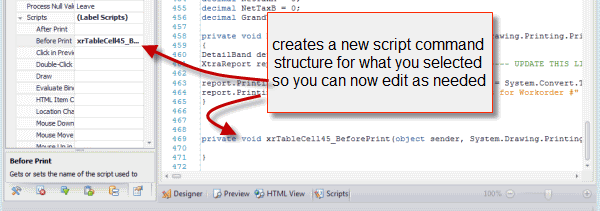
b. Create new script from within Scripts panel:
i. instead of via the Properties tab, just select the band/label from the selection at the top of the Scripts panel
ii. than select the type of script (i.e. Before Print, etc)
iii. the script command structure will be added into the Scripts for you to now edit as needed

6. Providing script support is outside of the realm of AyaNova's free support.
If you are interested in having a custom report template created for you, provide the following information sent directly to support@ayanova.com
•a mockup of the report you would like (in Word, Excel, PDF) or existing report template exported to file from AyaNova that you want further customized.
•identify from what AyaNova entry screen or grid this report is for (from Service Workorder entry screen, from Client entry screen, from Labor grid in Service navigation pane, etc)
•identify in red font in the mockup the datafields that correspond with fields of that AyaNova entry screen
•if report will use logos or images, be sure to provide also attached to your email
•any additional information you believe may be relevant that will help me understand how the report will look and act with actual data and how it will react based on the data.