Web app diagnostic log
The web app diagnostic log shows events such as errors that occur during use of the AyaNova web app in your browser.
The Web app diagnostic log is different and separate from the Server log which shows errors and events that occur at the AyaNova Server end of things.
This log can be useful for troubleshooting purposes.
Authorization Roles required
This form is available to each User.
How to access the log
The log is reached from the About form's Log menu item.
How the log works
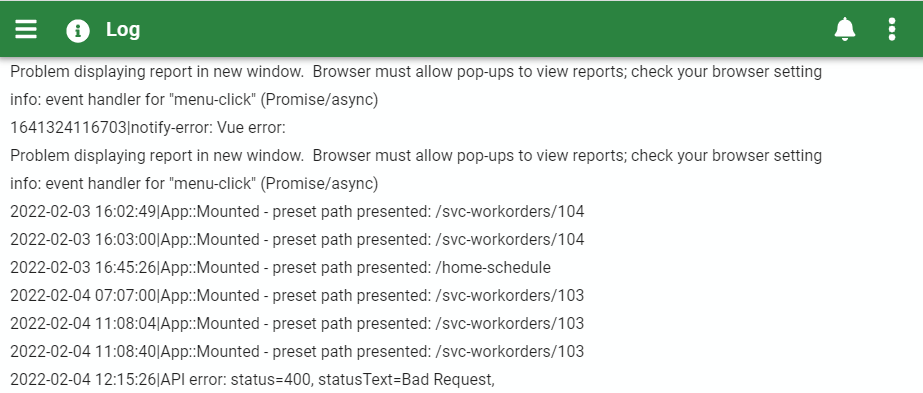
AyaNova keeps a log contains the most recent 100 log items. When a new item is added and the log already has 100 items, the 100th item is dropped from the log.
AyaNova mostly logs error messages but it also can contain other diagnostic information of use to technical support for troubleshooting purposes.
When you see an error displayed in AyaNova chances are it was also logged here so it's a useful way to go back and look at an error message again if necessary.
Gathering information for technical support
The log display is intended for reading only, if you need to send the log or save it for later, the About form's "Copy support information" menu option will automatically copy the log contents as well as some comprehensive diagnostic information about the current browser in use and other information potentially useful when requesting support.
Because the log only retains the most recent 100 items, it is sometimes necessary to recreate an error before copying the log to send to technical support as the error could have been rotated off the log if many other items were logged since the error first appeared.